VISUALIZATION
2D & 3D Visualization
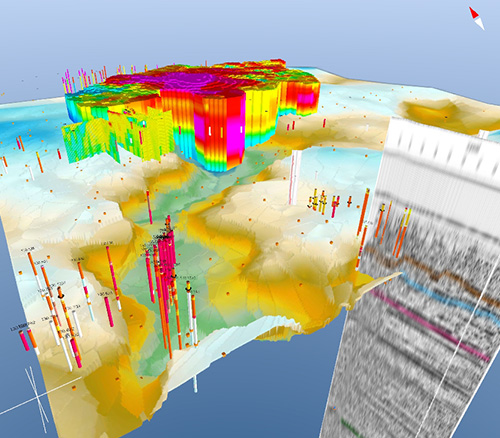
Data can be visualized in 2D on cross sections and in map windows, and in 3D, by navigating around in a 3D setting visualizing your project data.
There are several options to customize the appearance of your data, including e.g., horizontal, and vertical slices of 3D grids /voxel models and in layered models as well.
GeoScene3D also includes functionalities to make animations (e.g., a time series of water level maps) and flight paths, where the camera in 3D flies around showing data from different angles and perspectives.